See your design system live in your dev server.
A zero-config inspector overlay that auto-mounts the moment you wrap your app in ThemeProvider. No browser extension, no setup, no extra dependency — just open your dev server and inspect.
The inspector scans your live DOM, flags token violations, and guides the agent to fix them — all in real time.
One prop. That's the entire setup.
The inspector is built into ThemeProvider. It reads your NODE_ENV and mounts automatically in development. No separate package, no config file, no build step.
<ThemeProvider
  devTools={process.env.NODE_ENV !== "production"}
>
  <App />
</ThemeProvider>

// Inspector auto-mounts in dev mode.
// Set devTools={true} to force-show in production.Inspect components, tokens, and export AI context.
Each mode answers a different question: What is this? What tokens drive it? How do I tell my AI to rebuild it?
01Component Inspector
Hover any element on the page to see its primitive name, CVA variants, and full prop breakdown in real time. No browser DevTools needed.
- Primitive name resolution
- CVA variant display
- Prop tree inspection
02Token Inspector
Inspect the resolved semantic token values driving each component — accent, radius, surface, and spacing scales rendered as live values.
- Live token resolution
- Accent & radius scales
- Surface hierarchy mapping
03AI Context Export
Copy a ready-to-paste component spec for your AI assistant — token assignments, variant matrix, and accessibility metadata in one block.
- One-click clipboard copy
- Full variant matrix
- WCAG metadata included
Hover-to-inspect directly on your running application.
The inspector overlay floats above your dev server output. Move your cursor over any element to see its primitive identity and token assignments.
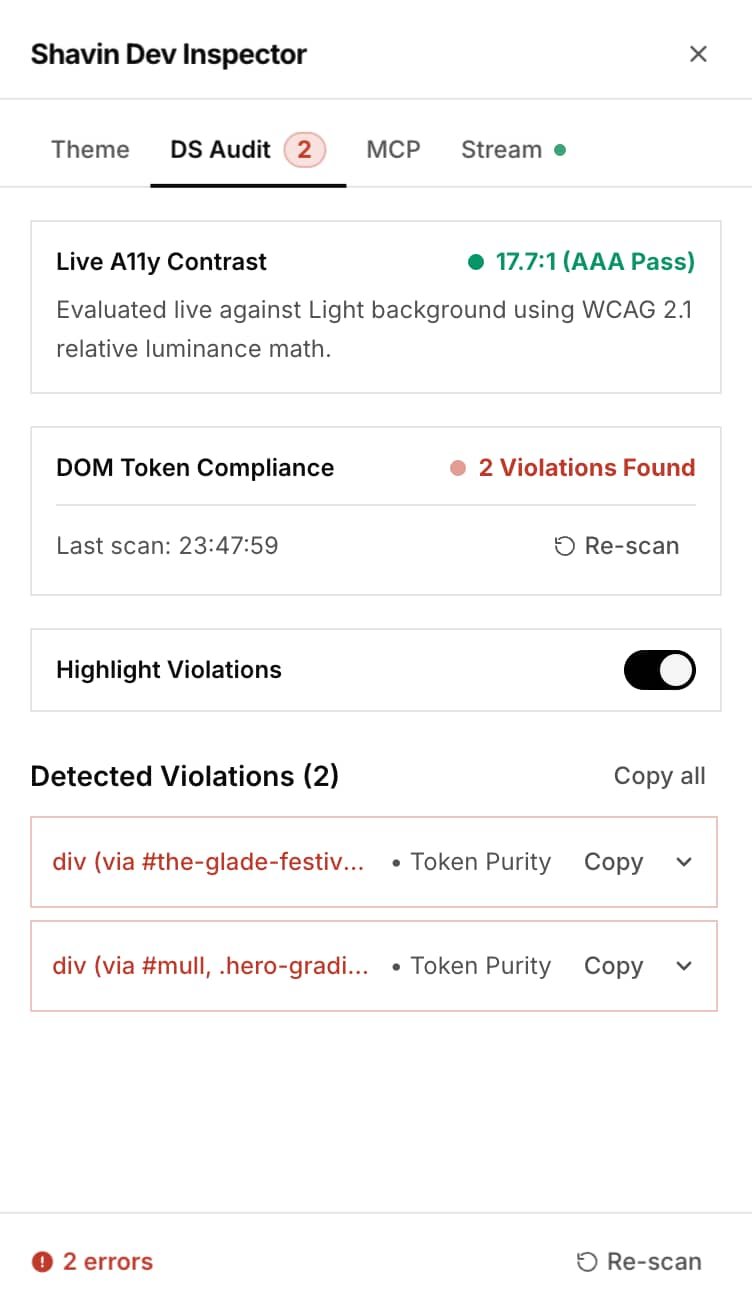
Catch violations before they reach production.
The inspector doesn't just display — it audits. Four real-time checks run continuously against your live DOM.
Contrast Checking
Real-time WCAG 2.1 contrast ratio computation for every text + background pair on the page.
Token Purity Scan
Scans the live DOM for hardcoded hex values, rgb() calls, and literal radii that bypass the semantic token layer.
Violation Hotspots
Highlights non-compliant elements directly on the page with inline annotations showing what's wrong and how to fix it.
Keyboard Navigation
Visual focus ring tracking and tab-order verification ensures every interactive element is keyboard reachable.
AI agents can audit your live DOM directly.
The Dev Inspector runs a bridge daemon on port :7428 that exposes a REST API. AI assistants query it to verify compliance without screenshots or human intervention.
Real-time compliance feedback
After code changes, agents call wait_for_live_clean to block execution until the hot-reloaded DOM reaches zero violations. No more "I think it looks right" — just verified compliance.
Path-targeted auditing
Pass a route path to isolate checks to the active tab, preventing crosstalk when multiple browser tabs are open.
// Bridge daemon runs on port :7428
// AI agents query live DOM compliance via HTTP:

GET http://127.0.0.1:7428/api/audit?path=/foundations/colors

// Response:
{
  "violations": 0,
  "warnings": 0,
  "tokenPurity": "100%",
  "contrastChecks": "all-pass"
}Browser, bridge, MCP, agent — a pull-based pipeline.
The browser continuously audits the DOM, but the MCP server never pushes those updates into the agent's context. Compliance data is shared only when the agent explicitly requests it — ensuring optimised token usage and zero context bloat.
01Browser renders
Your Next.js or Vite app runs normally. The Dev Inspector injects a lightweight observer that watches the live DOM for token violations, contrast issues, and radius compliance — on every render and hot-reload.
02Bridge streams continuously
The bridge daemon on :7428 maintains a persistent SSE connection to the browser. It broadcasts audit results in the background — but crucially, it does NOT forward them to the AI agent unless asked.
03MCP holds the buffer
The MCP server acts as a gatekeeper. It keeps the latest audit snapshot ready, so the agent's context window stays clean. No polling, no spamming — the agent pulls compliance data only when it needs to verify a change.
04Agent pulls on demand
When the agent calls get_live_audit or wait_for_live_clean, MCP responds with the current snapshot in a single structured payload. This pull-based model ensures every token spent on context is intentional and relevant.
Continuous monitoring, pull-based delivery
The bridge streams audit data every render cycle, but MCP buffers it silently. The agent's context window only receives compliance results when it calls get_live_audit — one structured payload, on demand. No token waste, no context pollution.
Inspect your design system in real time.
Wrap your app in ThemeProvider with devTools enabled and the inspector appears automatically.